How to Measure, Understand, and Maximize the Value of Your Digital Tools
Why User Adoption Is Still the Blind Spot in Digital Transformation
Digital tools are everywhere: from BI platforms and CRM systems to workflow automation, analytics, and cloud services. But the real question isn’t whether you’ve rolled them out – it’s whether your people are actually using them to their full potential.
For most global enterprises, user adoption remains a blind spot:
- Who is engaging with the tools?
- Where is adoption lagging?
- What is the user experience?
- Are we getting the ROI we expected?
If your answers are unclear, you’re not alone.
Most organizations struggle to track user adoption across departments, regions, and tools. They rely on anecdotal feedback, outdated license metrics, or superficial login counts. That’s not enough.
What’s needed is true adoption intelligence: a combination of user activity, satisfaction insights, and real-time dashboards that make digital adoption visible, measurable, and actionable.
Turning Data Into Action – Empowering Global User Adoption Management
Quick Facts
- Industry: Global Enterprise (10,000+ Employees)
- Challenge: Lack of visibility and strategic control over user adoption
- Services Provided: User Adoption Consulting, Dashboard Development, Employee Satisfaction Measurement
- Duration: Strategic initiative over several months
The Challenge
In a globally distributed organization, dozens of critical digital applications had been deployed – but there was no unified understanding of how they were being used. Leadership lacked visibility into real adoption rates, user satisfaction, and friction points. Decisions around IT budgets, training programs, and vendor negotiations were being made in the dark.
Our Approach
- Built a company-wide User Adoption Dashboard to track engagement across core applications
- Designed a Management Overview layer with executive-level KPIs and trend summaries
- Launched a structured Customer Satisfaction Score (CSS) system covering six key dimensions: usage, training, rollout, usability, support, and incident handling
- Embedded adoption insights into IT governance, vendor reviews, and application lifecycle planning
The Impact
- Enabled strategic decisions based on real usage data, not assumptions
- Strengthened negotiation power with vendors and service providers
- Identified adoption gaps and guided targeted support and training initiatives
- Improved end-user experience, increased satisfaction, and reduced friction in digital transformations
Key Learning
Visibility is power.
Only by combining technical data with human feedback can you build a true picture of how technology is working, and where it isn’t. A well-designed adoption dashboard becomes a strategic lens on your digital ecosystem.
What We Offer – A Complete Framework for Measuring and Managing Adoption
At Innolifters, we help global companies make digital adoption measurable, manageable, and meaningful – across any application, any region, and any role.
1. Strategic CSS Surveys
We design and deploy multilingual, modular surveys tailored to application and business context. Our CSS covers:
- General usage
- Rollout experience
- Support
- Enablement
- User satisfaction
- Proficiency
Delivered via Qualtrics or your internal tools, our surveys provide not just feedback — but insight.
2. User Adoption KPI Definition
We define and track the right metrics for each tool and business function:
- Active users by region, division, or role
- License utilization
- Session frequency
- Training completion
- Role-based engagement (creators vs. consumers)
- Support volume and friction indicators
We work directly with your usage logs, license data, and organizational structures to make adoption performance visible across the enterprise.
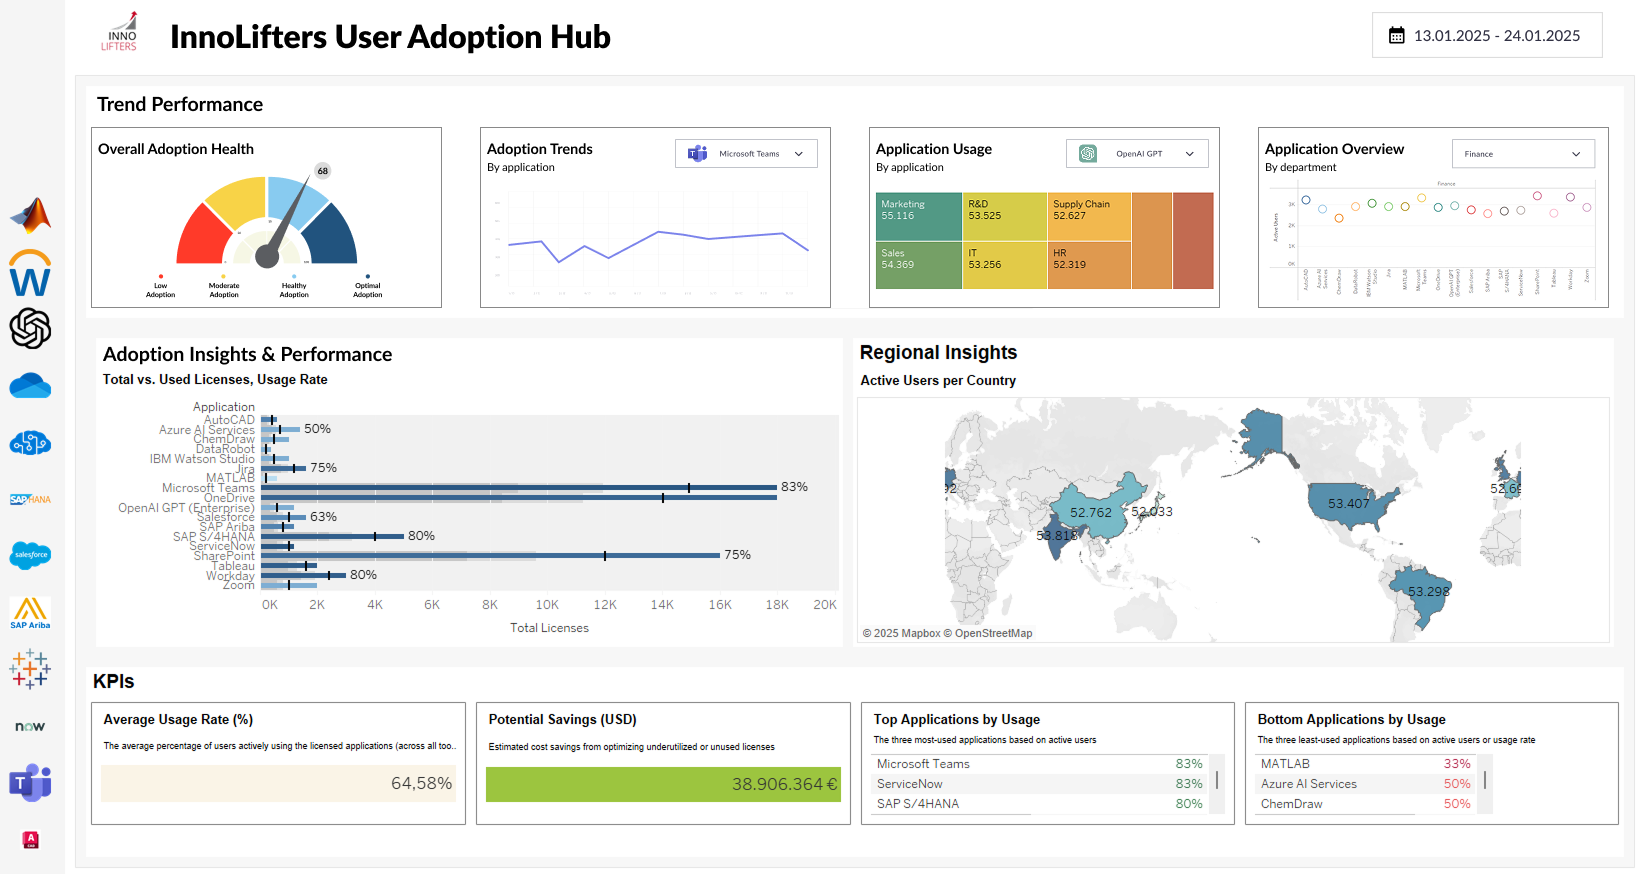
3. Visual Dashboard Development
We build executive-ready dashboards (e.g., in Tableau or Power BI) to bring it all together:
- Side-by-side view of usage and satisfaction
- Filters by region, business unit, role, and app
- Real-time tracking with historical trends
- Drill-downs to guide enablement, support, or vendor management
The dashboards are lightweight, flexible, and integratable into your existing BI environment.
You Can’t Optimize What You Can’t See
Without real user adoption data, even the best digital tools will underperform.
With our approach, you’ll know:
- Where adoption is strong – and where it’s not
- What’s working in rollout, training, and support
- How your people actually experience the technology you’ve invested in
- And how to continuously improve adoption with measurable outcomes
Ready to Turn User Adoption Into a Competitive Advantage?
If your digital transformation is missing transparency, it’s missing traction. Let’s fix that.
Contact us today to explore how we can help you build your own user adoption intelligence – and unlock the full value of your digital ecosystem.